 chemistryexplained.uk
In section 1.1 we considered how incredibly tiny atoms are and how it is almost impossible for us to envisage things so small. We also thought about units like the picometre that are appropriate for measuring such distances. And, although atoms of all the elements are extraordinarily small compared to us, they are not all exactly the same size.
An understanding of the relative size of atoms is extremely useful in many areas of chemistry. Regrettably, most of us are probably unlikely to remember (or even want to remember!) specific values for radius of each type of atom, and fortunately, we don’t have to! There are trends and patterns in how the size varies according to an elements’ position in the periodic table and this section will explain the reasons for those trends.
What is an atomic radius?
If we imagine an atom as being like a solid sphere, then the radius would simply be the distance from the nucleus (located at the very centre of the sphere) to edge. I’ve shown this on the diagram below:
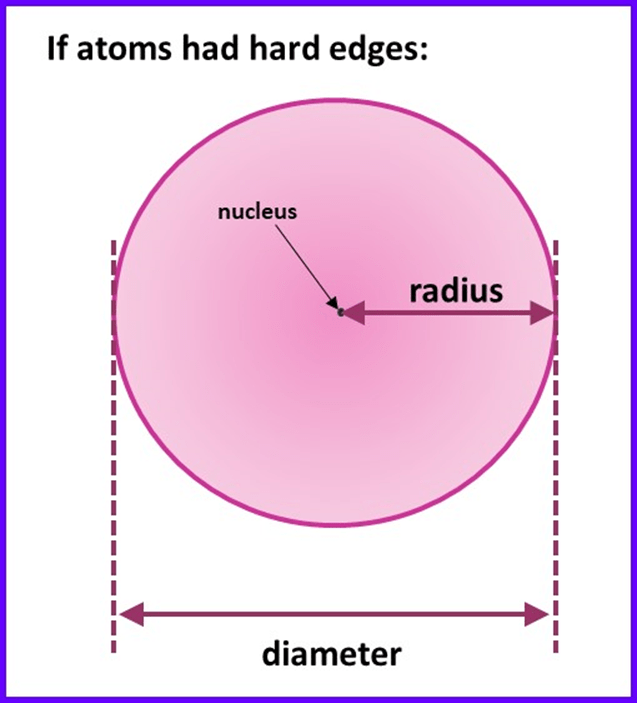
Unfortunately, things are not that simple, because as described in sections 1.9 and 1.10 atoms do not have hard edges – most of the space in an atom is electron orbitals which do not actually “end” at a specific distance from the nucleus. To make things even more complex, the distance between the nuclei of two neighbouring atoms will vary depending upon whether the atoms are bonded together or not and, if they are, whether the type of bond is metallic or covalent and so on. What this means in practice is that you will find several different values for the radius of a given atom, depending upon how it was measured and the type of substance the atom was in when the measurement was made. So, there isn’t one universally accepted radius for a particular atom. It also means that you can’t easily find values for the radii of all the elements measured in the same way, which makes trends and patterns harder to discern.
Consequently, for this article I have decided to use values for the atomic radius which have been “calculated” using quantum mechanics. These calculations determine the size of an electron orbital that has a 90% probability of containing the electron and this allows the “edge” of an atom to be estimated*.
A common misconception about periods
There is a very common misconception that many students have at the start of A-level, so let’s start by thinking about why it is wrong. The misconception is that “atoms get larger as you go along a period in the periodic table“. That would mean if we look at period 2, fluorine atoms would be larger than lithium atoms, because they have the larger atomic number and are further along the period. That doesn’t sound so unreasonable does it? Why wouldn’t that make sense? I mean, fluorine atoms have more protons, neutrons and electrons than lithium atoms, so of course they’re larger? But just look at the data in the figure below for the elements in period, where the “r” values give the calculated radius in picometres:
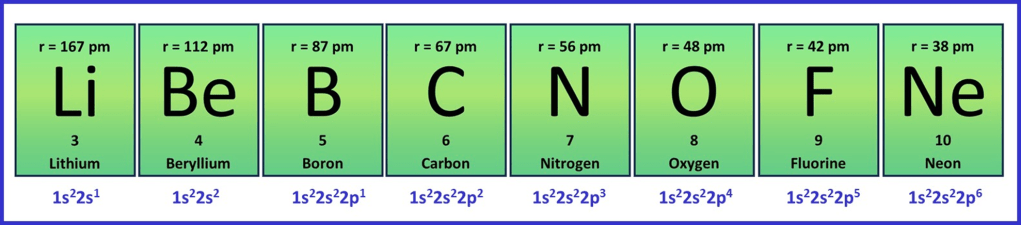
The data clearly shows that the atoms get smaller as you go across a period, the radius of a fluorine atom being around a quarter that of lithium. Why?
The key to understanding this potentially surprising result is to apply what we know about atomic structure.
Remember that scientists discovered that most of the mass of an atom is compressed into a miniscule nucleus at the centre, which makes up only a fraction of the total volume of an atom (Rutherford’s analogy was that the nucleus is like a fly in a concert hall). The rest of the atom is just empty space with a few electrons scattered through it. So, adding a few extra protons or neutrons to the nucleus only makes that tiny part of the atom larger and it doesn’t fill all the empty space and certainly doesn’t extend the size of the atom beyond that.
Trend in atomic radius across a period
The data above shows us that atomic radius decreases from left to right across a period, which is the direction of increasing atomic number. Fluorine atoms are smaller than lithium atoms, despite all the extra sub-atomic particles. The extra particles only fill a negligibly small part of the empty space, and we can expect the electrostatic attraction between the electrons and nucleus to increase. This occurs because each increase in atomic number means one more proton is added to the nucleus, giving a greater positive charge – which pulls the electrons inwards. Hence the radius decreases as the outermost electrons are on average closer to the nucleus. In a later section on ionisation energy we will see that the increase in electron-electron repulsion is not as significant, so the radius decreases.
Change in radius for a new period
The calculated atomic radius of neon is 38 pm. The next element, sodium, has one more proton, but it’s radius is 190 pm, which is 5 times greater! What has happened to cause this? Well, between these two elements there is the same increase in nuclear charge as there was between consecutive elements in the same period. However, the additional electron has gone into a new electron shell – sodium has a 3s electron, whereas neon filled only as far as the 2p sub-shell. Electrons in the third shell are on average further from the nucleus than those in the second shell and this exceeds the effect of increased attraction from the nucleus. Of course, we see a similar effect moving from argon (last element in period 3 with radius 71 pm) to potassium (first element in period 4 with radius 243 pm).
Trend in atomic radius down a group
The sequence of elements shown in the next diagram shows how the calculated atomic radius changes down Group 17 of the the periodic table. Equivalent trends are seen in the other groups as well.

The atomic radius increases quite significantly for each successive element lower down the group, so that in this case an iodine atom is almost three times the radius of a fluorine atom. The reason this time is much easier to understand – each successive position down the group means one more electron shell is added to the atom which is on average further from the nucleus. Although more protons are added as well (the atomic number increases) this does not compensate for the greater distance of the electrons from the nucleus.
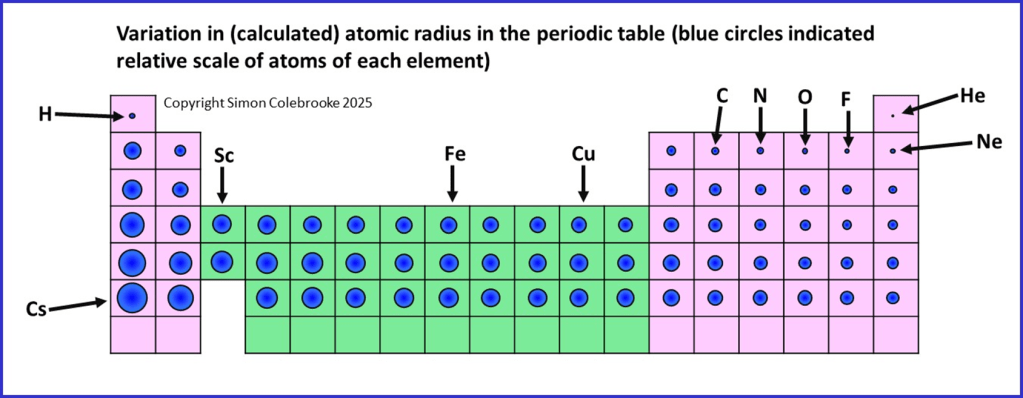
The outcome of these trends mean that we will find the largest atoms towards the bottom left-hand corner of the periodic table and the smallest atoms towards the top right corner. I have tried to illustrate the variations in the calculated atomic radius on the period table below, where the blue circles representing each atom are drawn to scale. A few specific elements have been indicated, but most are not for clarity.
Variation in atomic radius across the d-block elements
The diagram above also shows that atomic radius hardly changes across the d-block (which is shaded green). For example, the radii of scandium (Sc), iron (Fe) and copper (Cu) are barely distinguishable on the diagram. The reasons for this will be described in a later section on the d-block elements. After the d-block, atomic radius starts to decrease more significantly again until the period ends.
Consideration of the atomic radius will be extremely useful in understanding many properties of atoms and compounds, such as ionisation energy, electronegativity, bond strength and
“Copyright Simon Colebrooke 11th June 2025″
Suggested next pages
Click the icons below to either return to the homepage, or try a set of questions on this topic (choose the Q icon) or return to the Periodic Table notes menu (N icon).


* The values for calculated atomic radii I have used here can be found at webelements.com.
