The previous section described how dot-cross diagrams can be used to represent the covalent bonds present in small molecules. This section will give a wider range of examples and describe how you can convert dot-cross diagrams into full structural formulae (and vice-versa) and also draw dot-cross diagrams of ions.
1. Convert dot-cross diagrams into structural formulae
Water molecule
If we remember that a single covalent bond is a shared pair of electrons, it is relatively easy to use a dot-cross diagram to identify where the bonds are in a molecule. To start with, here is a very simple example of the dot-cross diagram for water:
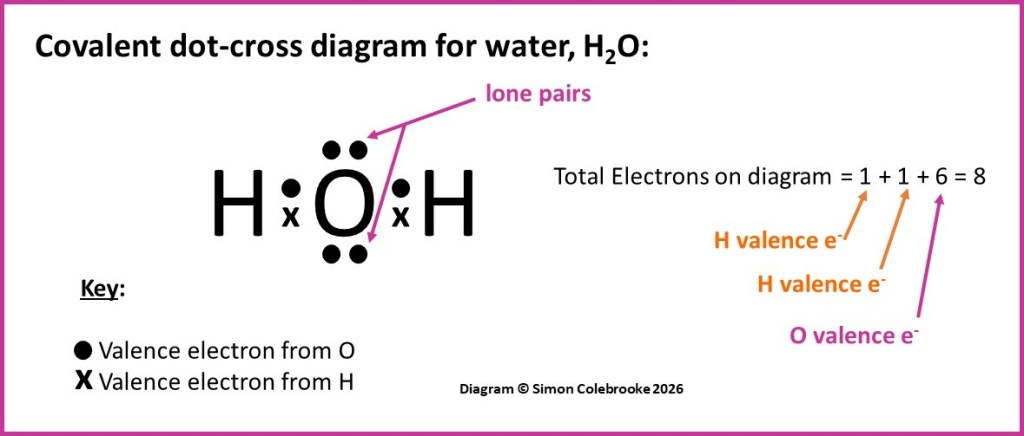
Some of the electrons on the oxygen atoms are not shared with any other atom, so they are not part of a covalent bond. They are “lone pairs” and important to many aspects of the water molecules shape and physical and chemical properties – but they won’t appear in a full structural formula.
Hence, we only need to look at the shared electrons. There are obviously two pairs of shared electrons – indicated by the dot-cross pairs on the diagram. This means there are two single covalent bonds in total, one between each hydrogen atom and the oxygen. These can be represented as single straight lines in a structural formula, which is shown below next underneath the dot-cross diagram:
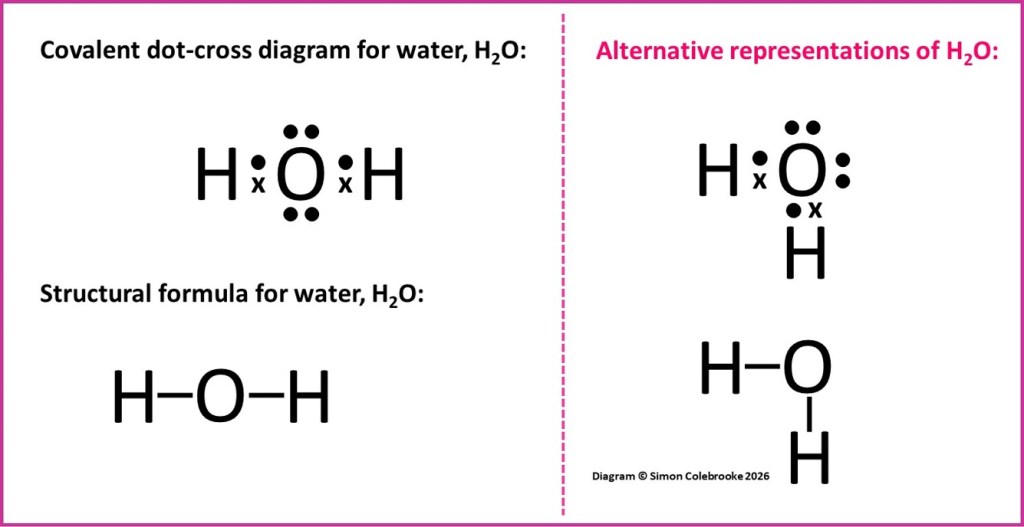
Notice that in the diagram above two different representations of the water molecule are shown. To the left of the pink dashed line the three atoms in the water molecule are arranged in a linear fashion, whereas to the right of the pink line one of the hydrogen atoms is directly beneath the oxygen atom whilst the other is to one side…. does this matter? The answer is not really – neither dot-cross diagram is giving any indication of the shape of the molecule. Their purpose is only to help us make sense of where the electrons in the covalent bonds originated and whether there are any non-bonding electrons. They are simplified representations of what a real water molecule is like. Similarly, it doesn’t really matter what the arrangement of the atoms in the structural formula looks like on the screen, unless it is required to convey some information about the shape or bond angle in the molecule. We will look into this more carefully in a later section including ways of representing 3-dimensional shapes on a flat surface. For the time being, either representation is enough to help us appreciate how the bonds form in a water molecule, and neither is completely correct if we need to consider the shape and bond angle. For clarity, molecules are often drawn in structural formulae with bonds at right angles to one another, but that is quite unusual in real molecules. What really matters is making sure the connections are correct and the bond order (single, double, triple etc).
Propyne molecule
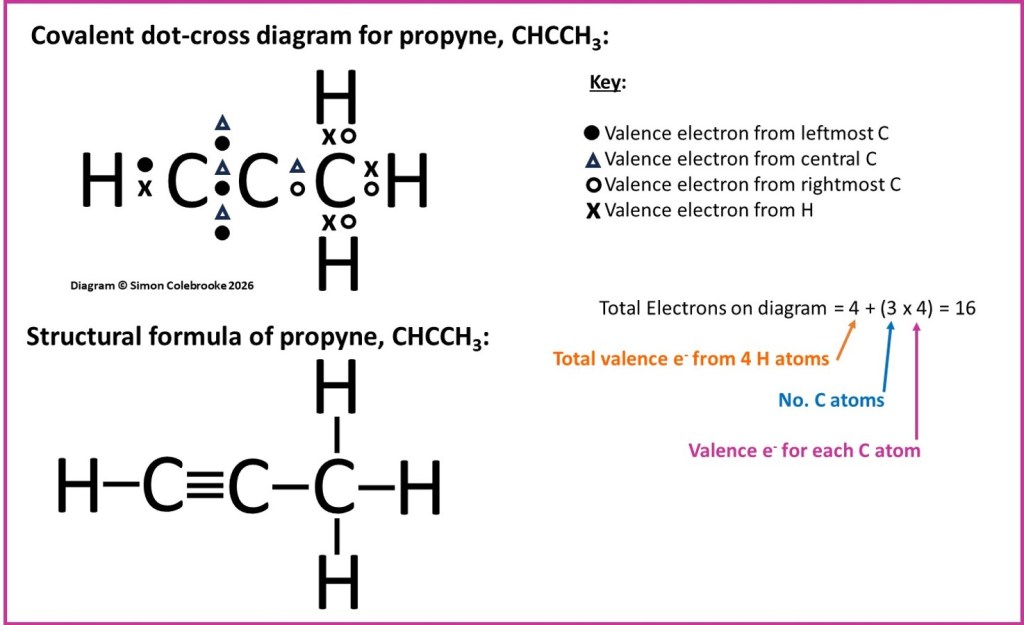
A slightly more complicated example is that of propyne, the dot-cross diagram for which is shown below. In this example, there are several covalent bonds; each H atom is covalently bonded to one of the carbon atoms (by single bonds), but there are also six electrons shared between the two carbon atoms on the left of the diagram. Six electrons corresponds to three pairs of electrons and so a triple bond between those two carbons. Finally, there is a single C-C bond involving the third carbon atom. This gives the full structural formula given in the diagram:
Alanine molecule
A third example illustrates a much larger molecule, alanine. However, apart from the additional number of atoms, there isn’t really anything more complicated to do in order to determine the full structural formula; just look for pairs of shared electrons and replace them with lines indicating the double, single or triple bonds. It is important not to connect atoms by bonds if they are not sharing electrons. The correct full structural formula of alanine is shown next to the dot-cross diagram below:
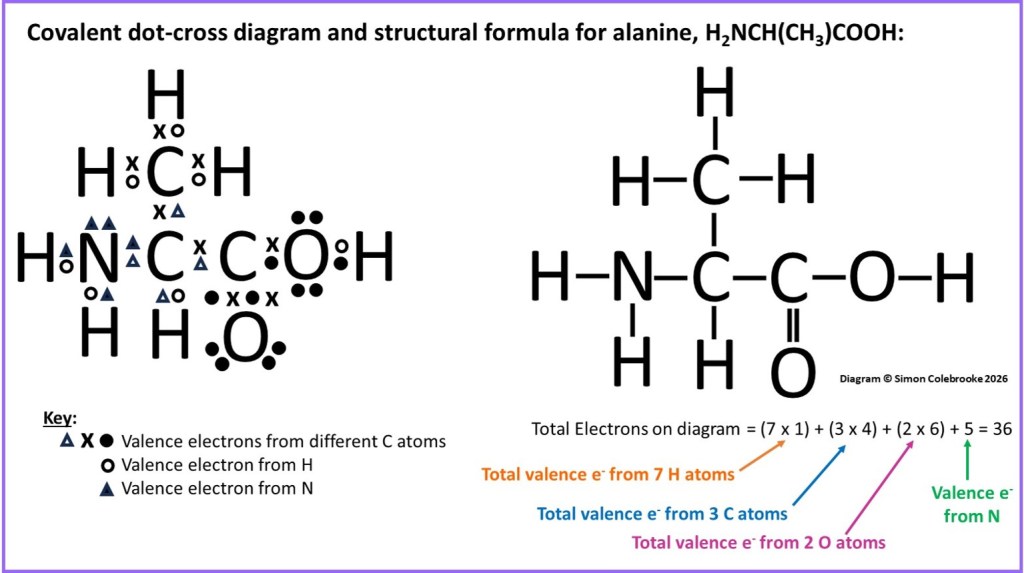
Remember that at this stage we are not too concerned with how the covalent bonds are orientated on the paper and there are several acceptable ways of drawing the full structural formula, only one of which are shown in the diagram.
2. Converting structural formulae into dot-cross diagrams
Carrying out the reverse process – creating a dot-cross diagram from a full structural formula – is a little more complicated. Now we have to decided which atoms will have lone pairs, as these are usually not shown in a full structural formula. This is relatively easy to do, if we think about the number of valence electrons possessed by each type of atom in the structure. The following series of steps can be used:
i). Draw the element symbols for each atom in the molecule, spread out with enough space between them to fill in the dots and crosses to show the electrons.
ii). Decide which type of symbol (dot / cross / triangle etc) will be used to represent the electrons of each atom.
iii). Add dot-cross pairs for each line / covalent bond in the structural formula.
iv). Work out how many valence electrons each atom ought to have – and add more electrons in lone pairs if they are not already represented on the dot-cross diagram.
A couple of examples below will illustrate the process:
Nitrogen molecule
As a first example, consider the nitrogen molecule, N2. Steps i) to iv) for converting the structural formula into a dot-cross diagram are indicated in the flow diagram below. There are three covalent bonds in the nitrogen molecule, meaning 6 electrons are shared between the two nitrogen atoms. If we use “dots” to show the electrons of one atom and “crosses” to show the electrons of the second atom, we can add these in as shown in step iii).
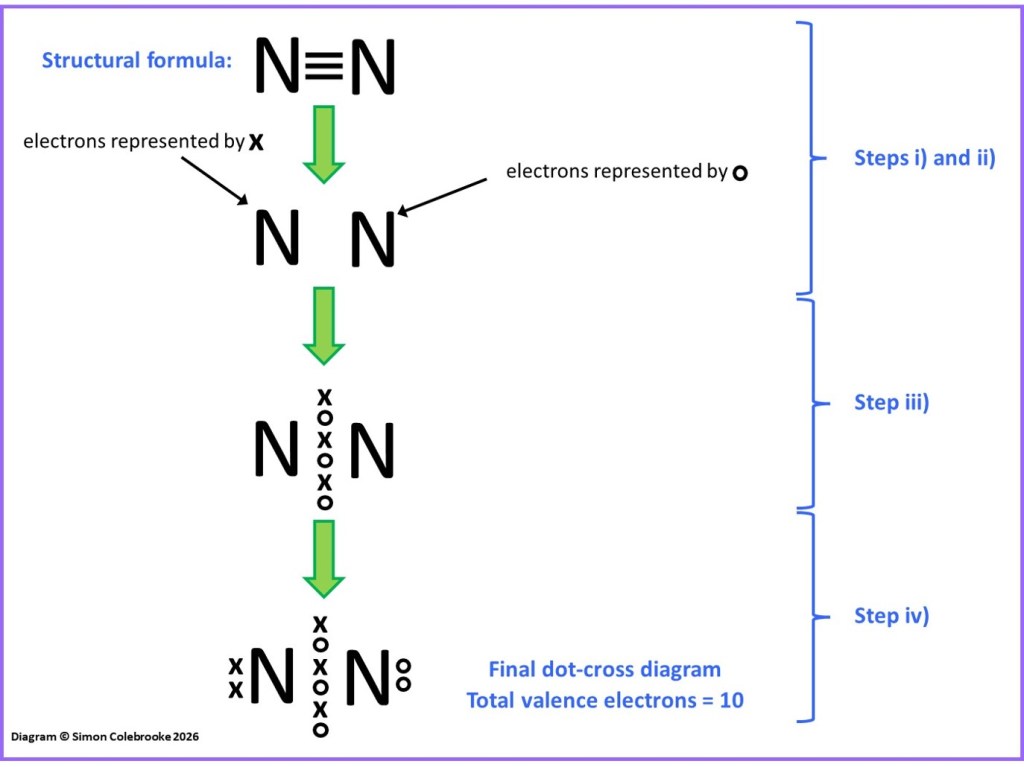
Nitrogen atoms have the electron configuration 1s2 2s22p3, meaning 5 valence electrons. These valence electrons should all be shown in a dot-cross diagram, which given there are two nitrogen atoms, means 10 electrons in total. Currently, after step iii) the dot-cross diagram there are only three included for each N atom. This means we need to add two more electrons for each nitrogen atom, two “dots” and two “crosses” to indicate which atom they originate from. This gives the final dot-cross diagram shown after step iv) with a lone pair on each N atom.
Methanal molecule
The methanal molecule is a good second example, shown by the dot-cross representation below. Following steps i) – iii) as above leads us the electron arrangement indicated in the flow diagram, which hydrogen electrons shown as “dots”, carbon electrons as “crosses” and oxygen electrons as “triangles”.
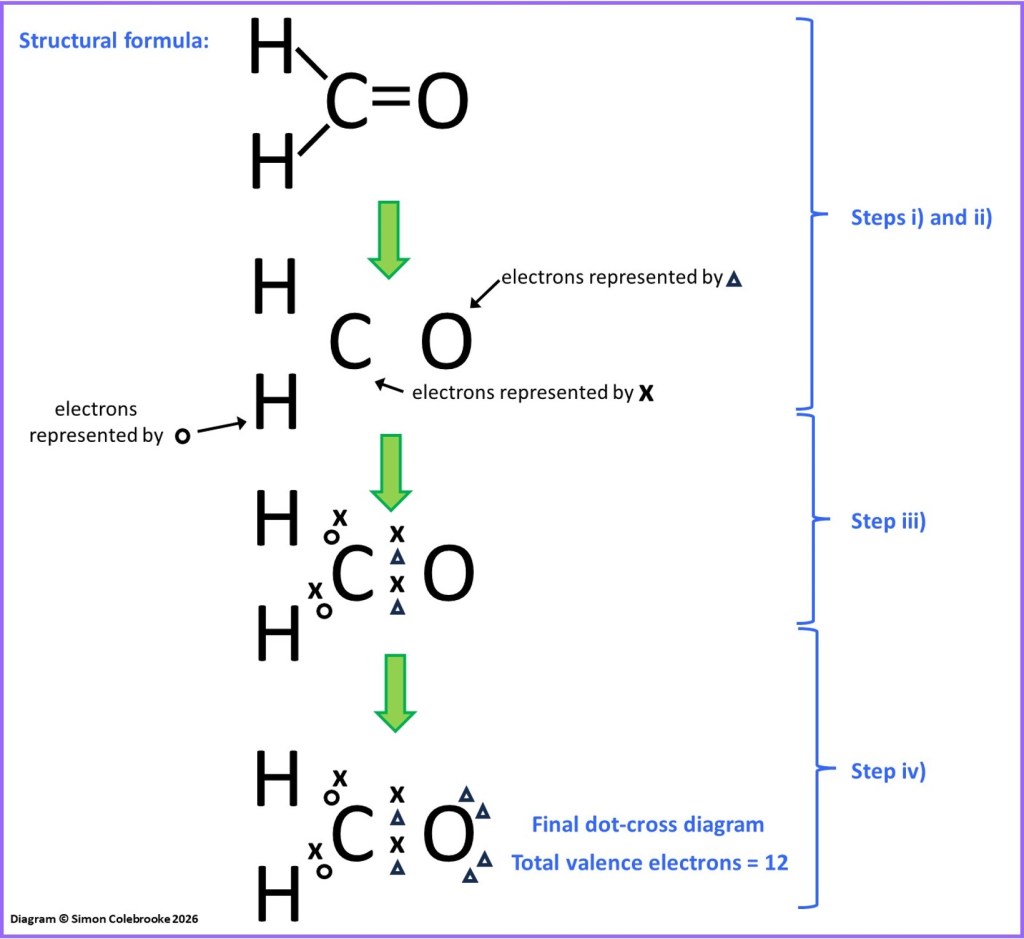
When we compare this with the total number of valence electrons each atom should have we find that the hydrogen atoms have all the required electrons (the electron configuration is 1s1 and a single electron is already shown for each H atom). Similarly, the carbon atom is shown with four electrons and that is all the valence electrons expected for carbon, since these atoms have electron configuration 1s22s22p2 (4 valence electrons). However, for the oxygen atom there ought to be six valence electrons shown – O atoms are 1s22s22p4 – and only two have been drawn in so far. Hence, another 4 electrons are needed for the oxygen atom, appearing as two lone pairs after step iv) of the flow diagram.
Dot-cross diagrams of ions
Neutral atoms and molecules have equal numbers of protons and electrons; the total positive charge of all the protons is exactly equal in size to the combined negative charge of all the electrons. The number of electrons to included in a dot-cross diagram for each atom is easily found by considering how many valence electrons each atom possesses.
Ions on the other hand, do not have the same number of protons and electrons; if the ion is positive there are more protons than electrons and vice-versa for negative ions. This situation arises because the ion has gained or lost some electrons relative to the individual atoms it is composed of.
When it comes to drawing dot-cross diagrams of ions were therefore need to add or remove electrons to reflect the overall charge. Look at the following examples:
Simple ions such as Cl– and Mg2+
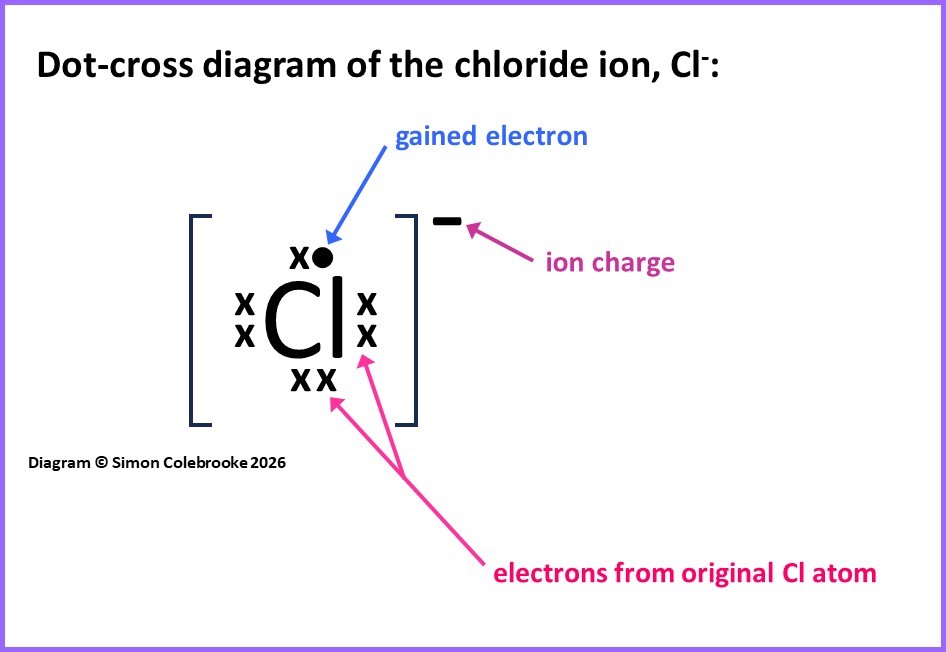
Simple ions are made from just one atom that has either lost or gained some electrons to end up with an overall charge. In the case of the chloride ion, Cl-, the ion has a negative charge, so there must be more electrons than protons in this species. Since Cl atoms and ions are defined by having 17 protons (the atomic number) there must be 18 electrons in this ion.
To draw the dot cross diagram we draw all the valence electrons in chlorine and then add one in a different symbol, to show it has been gained from some other atom or ion. So the dot-cross for Cl– is shown below, with 7 “crosses” representing the 7 valence electrons from a chlorine atom (1s22s22p63s23p5) and one “dot” representing a gained electron. Ions are usually drawn inside square brackets with the charge outside the bracket at the top-right. Hence we obtain this dot-cross diagram:
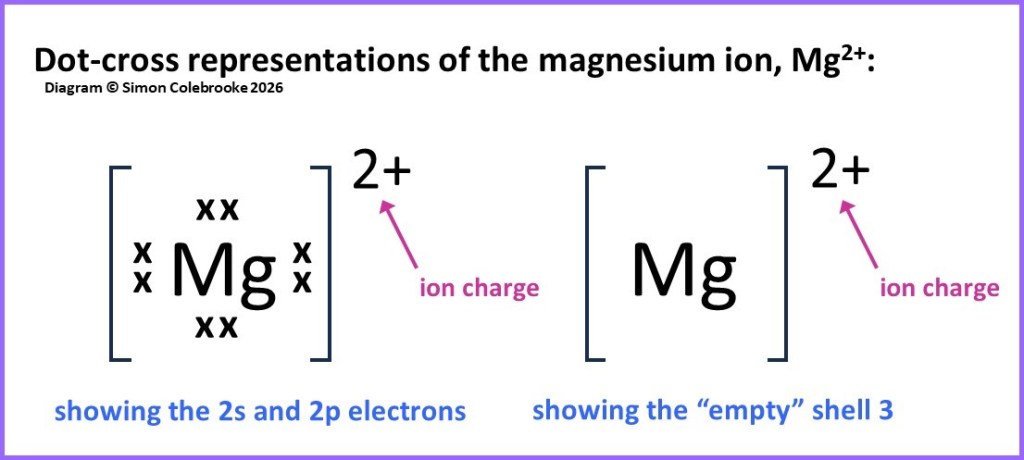
For a positive ion like Mg2+ we now need to remove 2 electrons compared to the neutral atom, so that there is an overall 2+ charge. Given that the electron configuration of Mg is 1s22s22p63s2 this means that both of the valence (3s) electrons are lost. This leaves a positive ion as the number of protons does not change. In a dot-cross diagram this can be shown as either an empty 3s valence shell (with no electrons drawn in) or as a filled second shell with 8 electrons drawn in. It doesn’t particularly matter which version you draw and both possibilities are shown below:
Hydroxide, OH–
The hydroxide ion represents a slightly more complex example, because it consists of two atoms covalently bonded together within the ion and then an additional electron that doesn’t originate with either the oxygen or hydrogen atoms.
However, we can easily work out how many electrons to draw in the dot-cross diagrams; it is 1 from the hydrogen atom, 6 valence electrons from the oxygen and 1 additional electron, so 8 electrons in total. It is then just a question of arranging them around and between the atoms to obtain a sensible distribution that meets the usual features of covalent bonding. Unless we know something specific about the atoms involved or the ion in particular we might as well aim for a situation where all atoms obey the octet rule as that is so very often the case. This is shown in the diagram below. From previous considerations we expect the hydrogen atom to only form 1 covalent bond, which would be shown as one shared dot-cross pair. However, we normally expect oxygen to form 2 bonds, but this isn’t possible here (there aren’t enough atoms remaining), so instead the oxygen can be the atom that effectively “gains” the additional electron. This results in the oxygen atom having a share of 8 valence electrons in total and the hydrogen atom a share of 2 valence electrons:
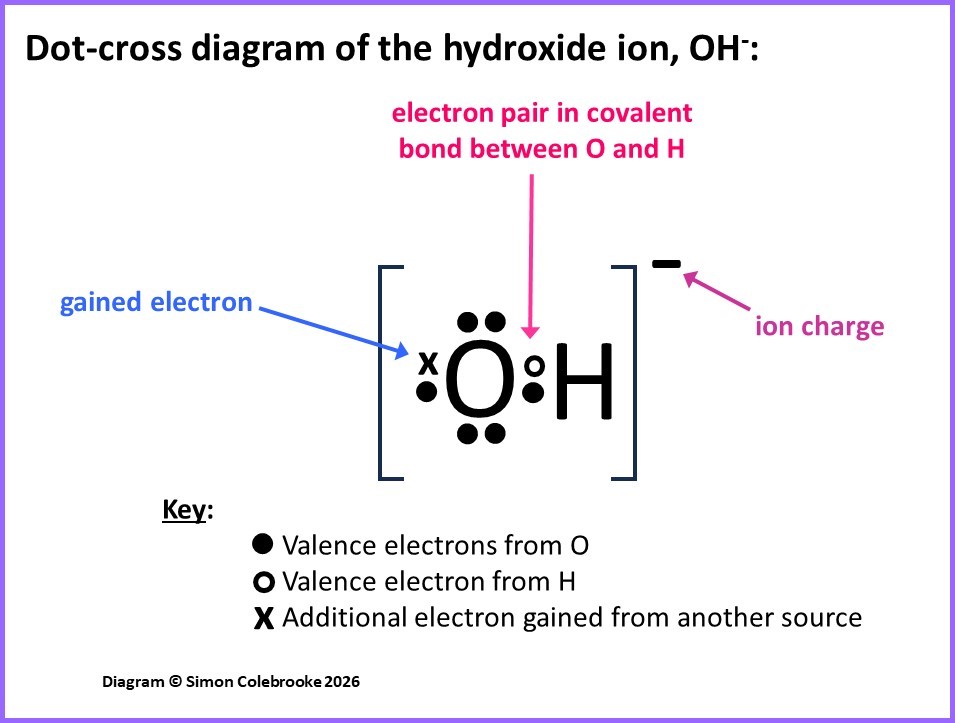
It is common to show the gained electron as part of a lone pair (rather than part of the covalent bond) although in truth, there is no way of knowing which electron was gained, they are indistinguishable to us… the dot-cross diagram is just to help us make sense of where the electrons originate and how they are arranged in the final ion.
Carbonate ion, CO32-
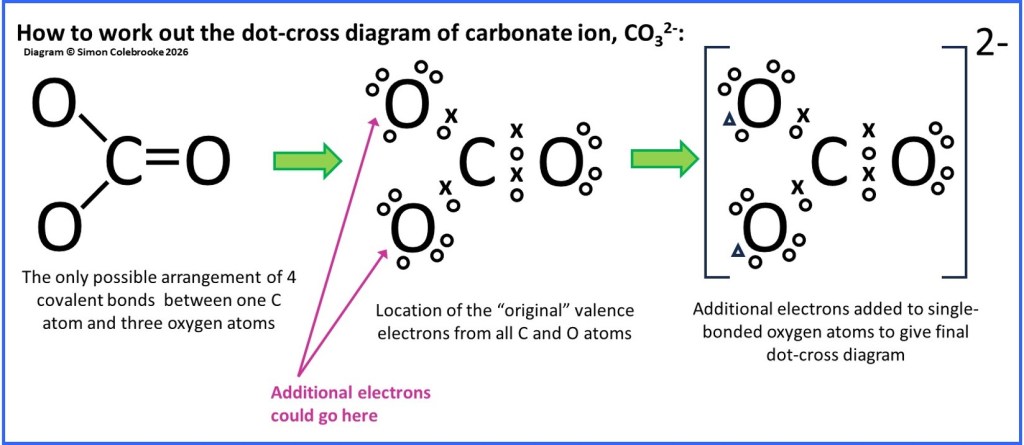
One final example for this section is the carbonate ion. This ion consists of one carbon atom, plus three oxygen atoms. There must be two additional electrons originating somewhere other than the bonded atoms, giving a 2- charge overall. Thus, we need to make sure that the dot-cross diagram has a total of 24 electrons; 4 valence electrons from the carbon, 6 valence electrons from each of the oxygen atoms and 2 additional electrons.
Where do the added electrons go?
If we again try to follow the octet rule, we can reason that the carbon atom must be centrally located and all three oxygen atoms bonded to the carbon. If the carbon is to form four bonds, it must make a double bond with one oxygen atom, but only single bonds with the others. If we then try to draw the dot-cross arrangement for this bonding pattern, adding in the lone pairs it becomes quite clear where the additional electrons must go; one on each of the single bonded oxygen atoms as these are the only places where electrons can go without causing one of the atoms to exceed the number predicted by the octet rule. Without the additional electrons, those oxygen atoms have a share of only 7 electrons and consequently a lone electron. Adding an additional electron to each singly bonded oxygen means that the ion follows the octet rule. The stages of drawing this diagram are shown below:
Notice that in the diagram I have drawn the additional electrons as “triangles” and part of lone pairs on the single-bonded oxygen atoms. This is the usual way of adding extra electrons to negative ions with oxygen, the extra electrons ending up on single-bonded oxygen atoms. However it is important to realise that there is really no way of knowing where they go; with a real molecule it is impossible to tell whether an electron started out on a C atom or an O atom or whether it came from some other source – electrons are all the same and don’t keep track of what atoms they used to be in. It is vital to realise that a dot-cross diagram is just a representation designed to help us make sense of how different molecules form; the electrons themselves are quite unaware of whether they are “dots” or “crosses” and where they are meant to be from!
Copyright Simon Colebrooke (15th January 2026)
Suggested next steps
Continue reading about covalent bonds by going to the next section on an orbital approach to understanding covalent bonding.